Americans across the political spectrum blindly rated the media bias of news reports from The New York Times and The New York Post during AllSides' Sept./Oct. 2022 Blind Bias Survey.
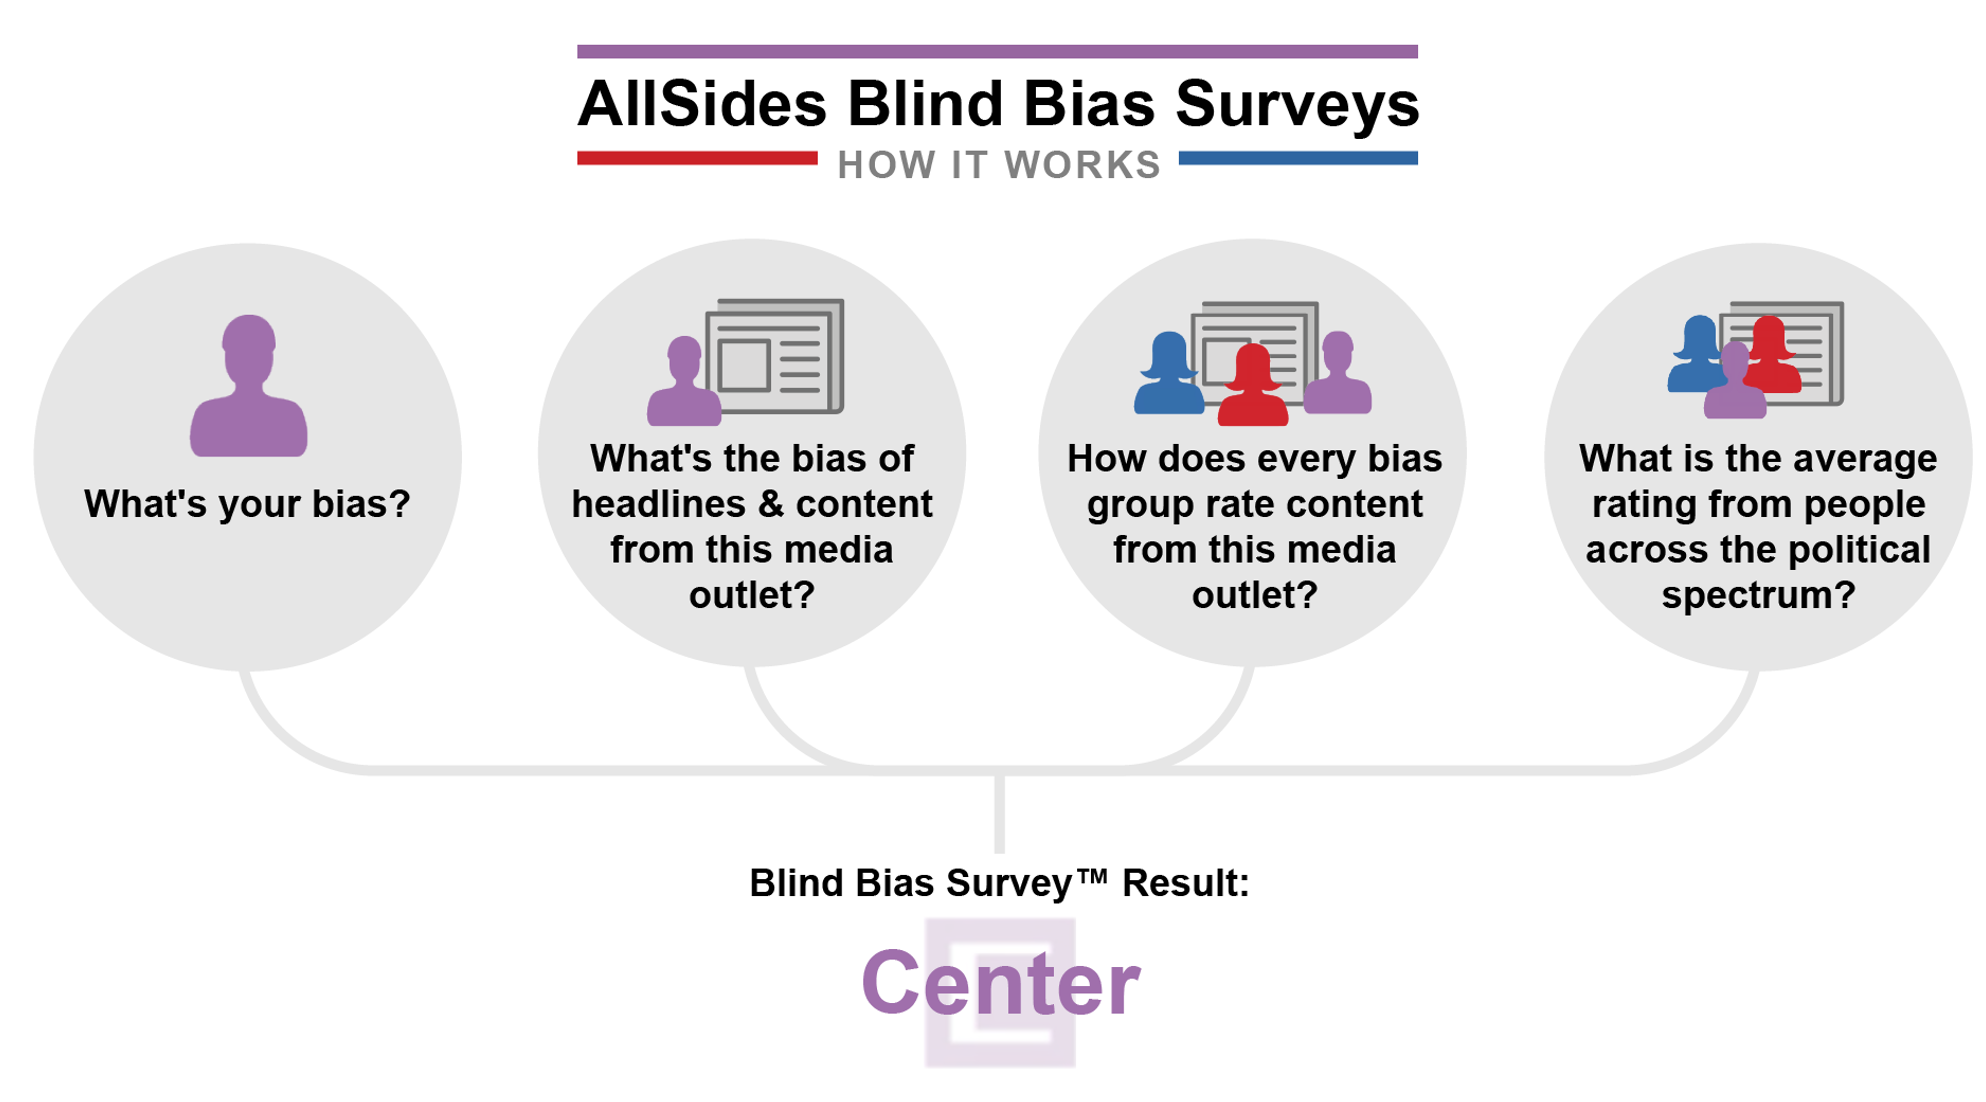
During an AllSides Blind Bias Survey, participants from all sides of the political spectrum are asked to rate the content of a media outlet blindly, so they are not influenced by preconceived notions of a brand's bias. Sign up to take part in the next survey.
Survey Results
On average, respondents across the political spectrum rated The New York Post as Lean Right and The New York Times as Lean Left, confirming AllSides' existing ratings at the time.

The New York Times Rated Lean Left
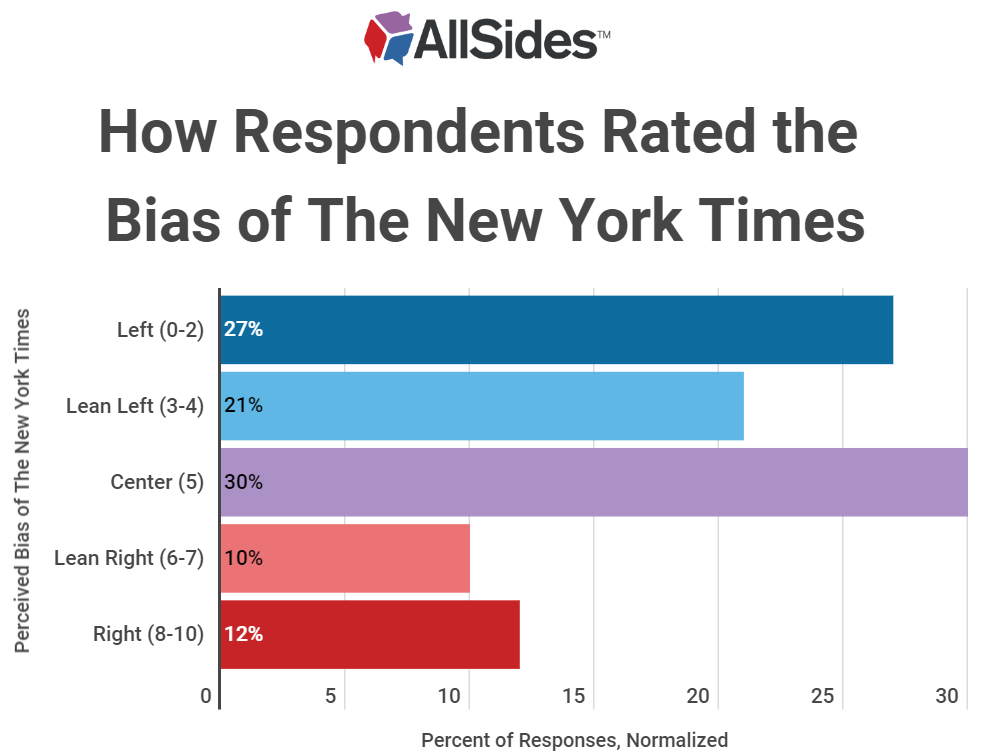
The normalized average for New York Times was -1.32 on a scale from -9 to +9, with 0 representing Center. That average is in the Lean Left category.
Overall, 49% of respondents rated New York Times as left of center, 30% rated it in the exact center, and 22% rated it as right of center.
Interestingly, we saw differences among respondents’ perception of The New York Times bias based on where they live.
The most common rating from a national sample of respondents recruited from SurveyMonkey for The New York Times was Lean Left, while respondents from AllSides’ audience of readers rated The New York Times as Left. Meanwhile, respondents in the New York City metro area rated The New York Times as Center. (Note this geographic data represents raw responses, not normalized averages).

The New York Post Rated Lean Right
The normalized average for New York Post was 1.26 on a scale from -9 to +9, with 0 representing Center. That average is in the Lean Right category.
Overall, 24% of respondents rated New York Post as left of center, 29% rated it in the exact center, and 48% rated it as right of center.
We saw differences in ratings for The New York Post based on respondent location and sourcing. While respondents in the New York City metro area and a national audience of AllSides readers both most commonly rated New York Post as Lean Right, the most common response among a national sample of respondents sourced from SurveyMonkey was Center. (Note this geographic data represents raw responses, not normalized averages).


About The Survey
A total of 706 people across the political spectrum took the survey. Each survey participant was asked to self-report their personal political bias – 132 participants with a self-reported Left bias; 160 with a Lean Left bias; 198 with a Center bias; 160 with a Lean Right bias, and 56 with a Right bias took the survey. These responses were normalized so that unequal sizes of these groups would not skew the final results in favor of one bias group over another.
Results are not assessed by majority rule; we calculate pluralities and averages, both within respondent groups and across all respondent groups, to arrive at final determinations.
For this survey, AllSides collected 12 pieces of content from the media outlets: top headlines taken on two different days at the same time of day, and top stories the outlet ran around two major national news stories. Stories and headlines were stripped of branding and any information that would allow participants to identify the outlet. Participants were asked to rate the overall bias of the source on an 11-point Likert scale. The point furthest to the left was labeled “Left”, the point furthest right was labeled “Right”, and the point in the center was labeled “Center”.

Results are represented on a scale of -9 to +9, with 0 representing dead Center, -9 representing Left and +9 representing Right:
Left: -9.00 to -3.00
Lean Left: -2.99 to -1.00
Center: -0.99 to +0.99
Lean Right: +1.00 to +2.99
Right: +3.00 to +9.00
Note About Blind Bias Surveys
Blind surveys are robust, but do have limitations. They alone do not always determine our ratings. These surveys ask respondents to assess a relatively small snapshot of the source's content in time. The surveys don't include photos, content published over a long period of time, or other crucial elements for determining bias. Therefore, we often use blind survey data in conjunction with other methods to arrive at a final bias rating, such as Editorial Reviews, third party data and independent reviews by AllSides reviewers.
AllSides uses multiple methods for calculating media bias ratings.
Our Blind Bias Survey, described in the graphic below, represents one of our most robust media bias rating methods, but it is not the only method we use. A source might openly share its bias, or it may be determined by third party research, an independent review, or an Editorial Review. Take a look at the multiple methods AllSides uses to measure and rate media bias.